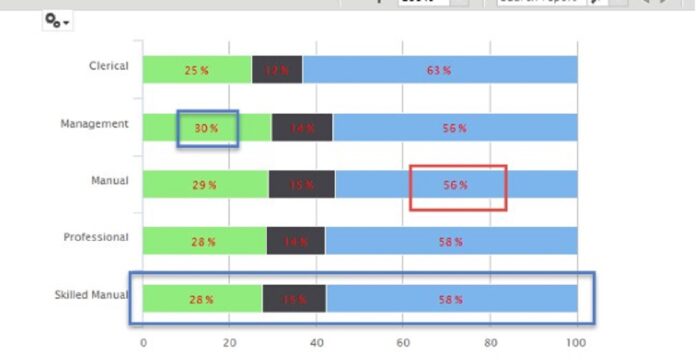
Modern business strategy heavily relies on the art of storytelling. Expressing complex data in an engaging manner can be the difference between successful and unsuccessful communication. Stacked charts can play a key role in elevating your business communication and storytelling. Keep reading to learn more about these charts and how they can benefit your data storytelling efforts.
Understand the Basics of Stacked Charts
Before diving into the storytelling aspect, it’s crucial to understand what stacked charts are. These charts plot data where part-to-whole relationships need to be emphasized. They can be based on absolute or relative values, empowering users to visualize an entire category and its components.
Stacked charts represent data in stacks, and each colored section of a stack represents a different data series. In turn, the total height of a stack signifies the total data of a category. This makes it easy for viewers to compare not only between different stacks but also within a single stack.
Being a subtype of either bar or line charts, stacked chart techniques can be adapted to various business communication needs. The core advantage of stacked charts lies in their ability to display segmentations within datasets. The data series within each stack can hold multiple pieces of information without overloading the viewer with too much information.
The Significance of Incorporating Stacked Charts in Storytelling
The incorporation of stacked charts in storytelling can elevate communication, especially in a business context. Storytelling allows data to be presented in a manner that is both engaging and easy to comprehend. Stories have a profound psychological impact on people- they have the power to engage, inspire, and teach. The analytic feature of stacked charts not only enables you to make data-driven decisions but also improves your strategic input to stakeholders.
Considering that fact, incorporating stacked charts into a narrative can give it a dimension of depth and context. These charts can make a narrative more tangible and relatable, reaching out to a wider audience. It’s about taking raw data and transforming it into compelling visual narratives.
In the context of business reports and presentations, the use of stacked charts aids in breaking down complex data into easily digestible segments. By representing data in a visual, layered manner, viewers can more easily understand the relationship between different data series and their impact on the whole.
From showing sales data segments to tracking changes over time, stacked charts are a powerful data visualization tool for enhanced data storytelling. Effective incorporation of these charts can indeed render your narrative much more impactful.
Master the Steps of Creating a Stacked Chart Narrative

Creating a stacked chart narrative requires a set of well-planned steps. It begins with identifying the data sets and determining the relationship between them. After getting a clear understanding of the data, begin by determining which data sets can be combined into a stack- remembering that they are ideal for depicting part-to-whole relationships.
Next, decide on the vertical or horizontal orientation for your stacked chart. This depends on the type of data and the relation between data series. Once the orientation is decided, stack your data series in a manner that clearly displays the relationship between different segments.
The design and interpretability of the chart narrative can be enhanced by using different colors for each data series within a stack. The colors should be distinct enough for the viewer to differentiate between different data series clearly. Finally, a legend and suitable labels should be added to ensure the viewer can understand the data without needing further explanation.
Read Also: Common Uses of Pressure Washer
Mastering each step of this process will enable you to present data-driven stories using stacked charts in a compelling and comprehensible manner. Remember, the steps should be tailored according to specific storytelling needs and target audiences.
Altogether, the impact of stacked charts can transform your ability to present data in an engaging manner. Master the art of storytelling with stacked charts to captivate and educate your audience simultaneously.


